crowd of students outside of Kidder Hall

Welcoming the class of 2023, next gen scientists!

By Debbie Farris

Science students at the 2019 Welcome Social

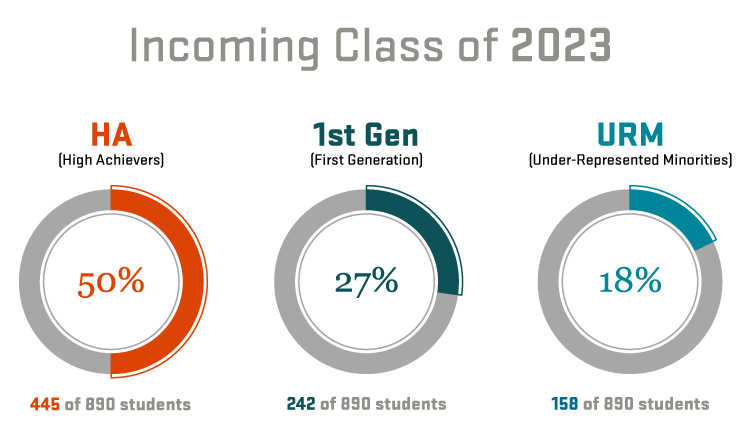
This fall, the College of Science welcomed 748 new first-year students, an increase of about 3% from fall 2018. Twenty-seven percent, or 242 first-year students, indicated they are first in their family to attend college, a 25% increase from last year; about 18% are underrepresented minorities.

Home to 3,145 undergraduate students, the College continues to attract the most high-achieving students at Oregon State University. Fifty percent of the incoming class are high achieving students, those who enter OSU with a high school GPA of 3.75 and above.

This fall, the College of Science welcomes 161 transfer students, 52% of whom are juniors and seniors. Roughly 22% of transfer students had a GPA of 3.75 or above, and 36% indicated they are first in their family to attend college. About 21% are underrepresented minorities.

“I am eager to welcome the class of 2023 to the College of Science. I encourage students to take make the most of their time here and get involved in the many opportunities to expand their personal, professional and intellectual perspectives through in science,” said Roy Haggerty, dean of the College of Science.

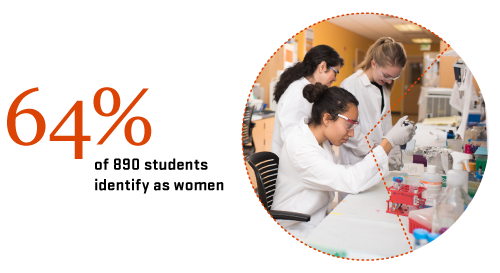
Here’s what our class of 2023 looks like:

  • 64% Female
  • 36 % Male
  • 27 % 1st generation
  • 18% Underrepresented minority students
Class of 2023 infographics

Overall, 86% of incoming first-year students are studying in the life sciences, which include biology, biohealth sciences, biochemistry & molecular biology, zoology, biochemistry and biophysics and microbiology.

Breakdown of majors for class of 2023

  • 295 biology majors
  • 245 biohealth sciences majors
  • 104 biochemistry & molecular biology majors
  • 72 zoology majors
  • 55 mathematics majors
  • 44 chemistry majors
  • 27 physics majors
  • 26 biochemistry and biophysics majors
  • 22 microbiology majors

Like in previous years, biology and the biohealth sciences majors attracted the greatest number of students—33% or 295 students, roughly the same as fall 2018; and 27.5% or 245 students, respectively. Of 890 students, about 3% are biochemistry and biophysics majors, 11.7% are biochemistry and molecular biology students, 8% are zoology majors, 6% will major in mathematics, 5% are chemistry majors, 3% are physics majors, and 2.5% are microbiology students.

With a strong laboratory and research focus, our Biochemistry and Molecular Biology major has nearly doubled its third cohort with 104 students. The Department of Mathematics welcomed 55 first-year students, continuing to break its record for the highest number of math majors by more than 30%.

According to the 2016 Annual Survey of Mathematical Sciences published by AMS, total undergraduate enrollments for mathematics, applied math, statistics and biostatistics across public and private universities (medium, small and large) has increased slightly from 2,481,000 to 2,518,000 since 2012. Mathematics doctoral departments such as OSU awarded 13 percent more bachelor’s degrees in 2016 as compared to 2015, an increase of 5%. Of those, 40% were earned by women, a nine percent increase. In 2016, master’s degrees awarded increased by 12% from 2015. Once again 40% of master’s degrees were earned by women, a 6% increase during the same period.

A look inside the class of 2023: Women power

The majority of the 890 in the class of 2023—64%, or 572 students—identified as women. While nationwide, women have been enrolling in and graduating from college in greater numbers than men for the last few decades, the data on women pursuing undergraduate degrees in science and mathematics tends to fluctuate across disciplines and fields. Data from the National Student Clearinghouse Research Center show that in 2017, 42% of women and 58% of men earned bachelor’s degrees in mathematics. In biological and agricultural sciences, the numbers were 60% women and 40% men.

women working in lab cropped in circle next to stats

The variation in enrollment data among various minority groups can be viewed in the context of national trends. The College of Science’s strong representation of women aligns with national trends based on a 2019 National Science Foundation Report on Women, Minorities and Persons with Disabilities in Science and Engineering. The report indicates that more women than men among all racial and ethnic groups enroll in college overall. Notably, the report revealed that underrepresented minorities, Hispanics in particular, represent an increasing share of students, whereas whites represent a decreasing share.

The NSF report referenced above also states that women have reached parity with men with bachelor’s degree in science and engineering, with women receiving over half of all bachelor, master’s and doctoral degrees in the biological sciences, the highest rates among the science and engineering fields based on 2016 data. However, women remain underrepresented in these occupations in the workplace.

Over the past two decades, although the percentage of underrepresented minority women and men receiving science and engineering degrees has steadily increased at all degree levels—from bachelor’s, master’s and doctorate—they have not increased proportionately to the U.S. population. Based on 2017 data from the same NSF study, women constitute 51.5% of the population, Hispanics or Latinos 14%, African Americans 12%, Asians 5% and other racial and ethnic groups combined were 2%. Despite these numbers, Asians continue to be overrepresented among science and engineering degrees and among employed scientists and engineers.

While African Americans, Hispanics or Latinos and American Indians or Alaska Natives have increased their share of science and engineering degrees, they too remain underrepresented in educational attainment and in the workforce.


Read more stories about: students